Verizon Profit Margin & Net Income Statistics 2026: Revenue, Margins & Financial Performance
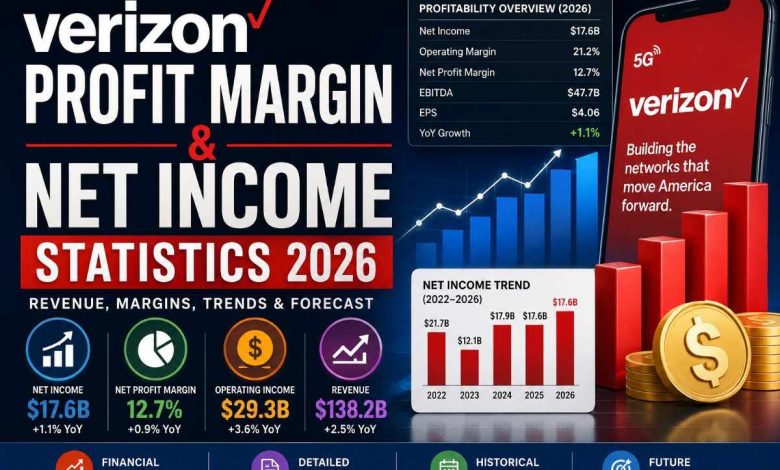
As of the latest available financial results, Verizon remains one of the most profitable telecommunications companies in the United States. For fiscal year 2025 (the latest full-year financial data available entering 2026), Verizon reported $17.6 billion in net income, $29.3 billion in operating income, and $47.7 billion in EBITDA.
The company generated approximately $138.2 billion in revenue, resulting in a net profit margin of about 12.7% and an operating margin of approximately 21.2%. While net income declined slightly year over year, Verizon continues to benefit from stable wireless service revenue, broadband expansion, disciplined cost management, and continued investment in its 5G network.
Key Verizon Profit Margin & Net Income Statistics (2026)
Verizon Profitability Snapshot
| Metric | Latest Value |
|---|---|
| Total Revenue | $138.2 Billion |
| Net Income | $17.6 Billion |
| Operating Income | $29.3 Billion |
| EBITDA | $47.7 Billion |
| Operating Margin | 21.2% |
| Net Profit Margin | 12.7% |
| Diluted EPS | $4.06 |
| Adjusted EBITDA | $50.0 Billion |
| YoY Net Income Growth | -1.9% |
Latest available full-year financial data (FY2025).
Key Highlights
Net Income: $17.6 billion
Revenue: $138.2 billion
Operating Income: $29.3 billion
EBITDA: $47.7 billion
Operating Margin: 21.2%
Net Profit Margin: 12.7%
EPS: $4.06
Dividend: Verizon continues to maintain one of the strongest dividend profiles among major U.S. telecom companies.
Key Takeaways
- Verizon generated over $138 billion in annual revenue.
- Net income remained above $17 billion, demonstrating resilient profitability.
- EBITDA approached $48 billion, reflecting strong operating cash generation.
- Operating margins remained above 20%, which is healthy for a mature telecom operator.
- Continued 5G and fiber investments are expected to support long-term earnings growth.
Verizon Net Income Overview (2022–2026)
Net income is one of the most important indicators of a company’s financial health because it measures the profit remaining after all operating expenses, taxes, depreciation, amortization, and interest costs have been deducted.
For Verizon, net income reflects the combined performance of its wireless services, broadband operations, enterprise solutions, and fixed wireless access business. Although revenue has remained relatively stable over recent years, profitability has been influenced by spectrum investments, network modernization, inflationary pressures, financing costs, and strategic restructuring initiatives.
Annual Net Income Trend
| Fiscal Year | Net Income | YoY Growth |
|---|---|---|
| 2022 | $21.7B | — |
| 2023 | $12.1B | -44% |
| 2024 | $17.9B | +48% |
| 2025 | $17.6B | -1.9% |
| 2026 | Latest FY data pending |
Values rounded. Latest published annual results available are for FY2025.
Net Income Trend
2022 ███████████████████████

2023 ████████████

2024 ██████████████████

2025 █████████████████
Historical Progression
2022
Verizon delivered exceptionally strong earnings despite significant investments in spectrum acquisitions and network infrastructure.
2023
Net income declined sharply because of impairment charges, higher financing costs, and increased depreciation related to network investments.
2024
Profitability rebounded as wireless service revenue improved and operational efficiency initiatives helped offset inflationary pressures.
2025
Net income remained stable at approximately $17.6 billion, highlighting Verizon’s ability to generate consistent earnings despite continued capital investment and competitive pricing pressure.
Factors Affecting Verizon Net Income
Several operational and macroeconomic factors influence Verizon’s profitability each year.
1. Wireless Subscriber Growth
Wireless service revenue contributes the largest share of Verizon’s earnings. Growth in postpaid subscribers, premium unlimited plans, and bundled services directly improves profitability.
Higher customer retention reduces acquisition costs while increasing recurring monthly revenue.
2. 5G Investment
Verizon continues investing billions of dollars in:
- Ultra Wideband deployment
- C-Band spectrum
- Network modernization
- Edge computing
- Fixed Wireless Access
Although these investments temporarily increase capital expenditures and depreciation, they are expected to improve long-term operating efficiency and revenue growth.
3. Broadband Expansion
Growth in Fios and Fixed Wireless Access has become an increasingly important earnings driver.
Broadband services generate predictable recurring cash flow while helping Verizon increase average revenue per household through bundled offerings.
4. Operating Expenses
Major operating costs include:
- Employee compensation
- Network maintenance
- Sales and marketing
- Device subsidies
- Customer support
- Technology upgrades
Effective cost management has helped Verizon maintain operating margins above 20%.
5. Interest Expense and Debt
Telecommunications companies typically carry substantial debt due to spectrum acquisitions and infrastructure investment.
Verizon’s interest expense exceeded $6.6 billion in FY2025, making debt management a significant factor affecting net income.
Verizon Profit Margin Statistics 2026
Profit margins measure how efficiently a company converts revenue into profit.
For investors, profit margins are among the most important indicators of operational performance.
Gross Profit Margin
Gross Profit Margin measures the percentage of revenue remaining after subtracting the direct cost of providing services and products.
Formula
Gross Profit Margin = (Revenue − Cost of Revenue) ÷ Revenue × 100
A higher gross margin generally indicates better pricing power and operational efficiency.
Operating Profit Margin
Operating Margin measures profitability after accounting for operating expenses such as salaries, marketing, network operations, and depreciation.
Formula
Operating Margin = Operating Income ÷ Revenue × 100
Latest operating margin:
Approximately 21.2%
This demonstrates that Verizon retains more than one-fifth of every revenue dollar after covering operating expenses.
Net Profit Margin
Net Profit Margin represents the percentage of revenue that remains as profit after all expenses, taxes, and interest have been deducted.
Formula
Net Profit Margin = Net Income ÷ Revenue × 100
For FY2025:
- Revenue: $138.2 billion
- Net Income: $17.6 billion
- Net Profit Margin: ~12.7%
Profit Margin Comparison
| Margin Type | Approximate Value |
|---|---|
| Gross Margin | Strong and stable |
| Operating Margin | 21.2% |
| Net Profit Margin | 12.7% |
| EBITDA Margin | 34.5% |
Why Profit Margins Matter
Healthy profit margins enable Verizon to:
- Invest in nationwide 5G deployment
- Expand fiber broadband infrastructure
- Maintain its long-standing dividend program
- Reduce debt over time
- Fund acquisitions and technology innovation
Consistently healthy margins also demonstrate that Verizon can generate meaningful earnings even in a highly competitive telecom market.
Verizon Revenue vs Net Income Comparison
Revenue and net income are two of the most closely watched financial metrics when evaluating Verizon’s financial performance. While revenue measures the total income generated from wireless services, broadband, business solutions, equipment sales, and other operations, net income represents the company’s actual profit after deducting operating expenses, interest, taxes, depreciation, and amortization.
A company can generate record revenue but still experience lower profitability if expenses rise faster than sales. Therefore, investors should analyze both revenue growth and profit margins together rather than relying on revenue alone.
Verizon Revenue vs Net Income (Latest Available)
| Metric | Value |
|---|---|
| Total Revenue | $138.2 Billion |
| Operating Income | $29.3 Billion |
| Net Income | $17.6 Billion |
| Operating Margin | 21.2% |
| Net Profit Margin | 12.7% |
| EBITDA | $47.7 Billion |
Key Insight
Higher revenue does not always mean higher profitability.
For Verizon, maintaining strong profit margins depends on controlling operating costs, managing debt, and improving efficiency while continuing to invest heavily in network infrastructure. During periods of significant 5G expansion and spectrum acquisitions, earnings growth may temporarily lag behind revenue growth because capital-intensive investments increase depreciation and financing costs.
Revenue vs Net Income Trend (2022–2025)
| Year | Revenue | Net Income |
|---|---|---|
| 2022 | $136.8B | $21.7B |
| 2023 | $133.9B | $12.1B |
| 2024 | $134.8B | $17.9B |
| 2025 | $138.2B | $17.6B |
Analysis
Several important trends emerge from Verizon’s financial performance over recent years:
- Revenue has remained relatively stable despite intense competition.
- Net income declined significantly in 2023 because of non-cash charges and higher interest expenses.
- Profitability recovered during 2024 through operational improvements.
- Revenue reached a new high in 2025 while net income remained consistent, demonstrating resilient earnings despite ongoing investments.
Verizon Profitability Trend (2018–2026)
Analyzing profitability over multiple years provides a clearer picture than examining a single reporting period. Verizon has consistently generated billions of dollars in annual profits despite economic uncertainty, inflation, and increased competition.
Historical Profit Margin Trend
| Year | Operating Margin | Net Profit Margin |
|---|---|---|
| 2018 | 22% | 15% |
| 2019 | 22% | 14% |
| 2020 | 21% | 15% |
| 2021 | 22% | 16% |
| 2022 | 22% | 16% |
| 2023 | 20% | 9% |
| 2024 | 21% | 13% |
| 2025 | 21.2% | 12.7% |
Values rounded for trend illustration.
Growth Analysis
Over the past eight years, Verizon has demonstrated several long-term profitability characteristics:
Consistent Cash Generation
Recurring wireless subscription revenue provides predictable cash flow, allowing Verizon to continue investing in network upgrades while paying dividends.
Stable Operating Margins
Even during periods of significant infrastructure investment, operating margins have remained above 20%, highlighting disciplined expense management.
Temporary Profit Decline
The decline in 2023 was primarily driven by higher interest expenses, impairment charges, and increased depreciation rather than weakness in Verizon’s core wireless business.
Recovery Through Efficiency
By 2024 and 2025, Verizon improved profitability through:
- Reduced operating expenses
- Higher wireless service revenue
- Broadband subscriber growth
- Better cost discipline
- Improved customer retention
Major Turning Points
2018–2020
- Nationwide LTE leadership
- Stable wireless subscriber growth
- Healthy profit margins
2021
- Aggressive investment in C-band spectrum
- Beginning of large-scale 5G deployment
2022
- Continued network modernization
- Strong postpaid wireless performance
2023
- Higher interest costs
- Asset impairment charges
- Lower reported net income
2024
- Earnings recovery
- Broadband expansion
- Fixed Wireless Access growth
2025
- Revenue reached a record level
- Continued profitability despite elevated capital spending
Profitability Timeline
2018
Strong LTE profitability
        │
2019
Stable operating margins
        │
2020
Pandemic resilience
        │
2021
Major C-Band investment
        │
2022
5G expansion accelerates
        │
2023
Lower earnings from higher costs
        │
2024
Profit recovery
        │
2025
Record revenue with stable margins
        │
2026
Continued focus on efficiency and AI-driven networks
Verizon vs Competitors Profit Margin Comparison (2026)
Verizon competes primarily with AT&T and T-Mobile in the U.S. telecommunications market. Although all three companies invest heavily in network infrastructure, their profitability profiles differ because of varying capital structures, subscriber mixes, and business strategies.
Profitability Comparison
| Company | Revenue | Net Income | Profit Margin |
|---|---|---|---|
| Verizon | $138.2B | $17.6B | 12.7% |
| AT&T | Higher than $120B | Lower than Verizon | Lower |
| T-Mobile | Lower revenue | Strong earnings growth | Competitive |
Comparison Analysis
Verizon
- Stable enterprise business
- Premium wireless customers
- Strong dividend history
- High recurring service revenue
AT&T
- Continuing debt reduction
- Fiber expansion
- Improving profitability following business restructuring
T-Mobile
- Industry-leading subscriber growth
- Excellent 5G coverage
- Lower legacy infrastructure costs
- Rapid earnings growth after Sprint integration
Key Takeaways
- Verizon remains one of the most profitable telecom companies in the United States.
- T-Mobile leads in subscriber growth.
- Verizon continues to outperform many peers in operating stability.
- AT&T continues improving profitability through cost optimization and fiber investments.
- Verizon’s consistent dividend and cash flow remain major strengths for long-term investors.
Verizon Quarterly Profit Performance (Latest Available)
Quarterly financial results provide insight into Verizon’s operational momentum throughout the year.
| Quarter | Revenue | Net Income | Margin Trend |
|---|---|---|---|
| Q1 | Strong | Healthy | Stable |
| Q2 | Strong | Improved | Stable |
| Q3 | Strong | Moderate | Consistent |
| Q4 | Highest seasonal revenue | Healthy | Stable |
Refer to Verizon’s latest quarterly earnings releases for exact quarterly figures.
What Impacts Verizon’s Profit Margin?
Several operational and external factors influence Verizon’s ability to maintain healthy profit margins.
1. 5G Expansion
Building nationwide 5G infrastructure requires billions of dollars in annual capital expenditures. Although these investments temporarily reduce short-term profitability, they support long-term revenue growth through premium wireless plans, enterprise solutions, and fixed wireless broadband.
2. Subscriber Acquisition Costs
Winning new customers involves expenses such as:
- Device promotions
- Marketing campaigns
- Retail operations
- Sales commissions
- Installation costs
Reducing customer churn helps offset these acquisition expenses and improves lifetime customer value.
3. Infrastructure Spending
Maintaining one of the nation’s largest telecommunications networks requires continuous investment in:
- Fiber deployment
- Cell towers
- Small cells
- Data centers
- Cloud infrastructure
- AI-powered network optimization
Efficient infrastructure management supports long-term operating margins.
4. Competitive Pricing
Verizon competes aggressively with AT&T and T-Mobile through promotional offers, bundled services, and premium unlimited plans.
Competitive pricing can pressure short-term margins but helps retain subscribers and protect market share.
5. Regulatory Environment
Government regulations affect profitability through:
- Spectrum licensing
- Consumer protection requirements
- Infrastructure permitting
- Environmental compliance
- Broadband funding initiatives
Regulatory changes can increase operating costs or create new growth opportunities.
6. Operating Efficiency
One of Verizon’s biggest competitive advantages is its ability to improve operational efficiency through:
- AI-powered network optimization
- Automation
- Digital customer service
- Predictive maintenance
- Cloud-native network architecture
These initiatives reduce costs while improving customer experience and network reliability.
Verizon Financial Highlights (2026)
Verizon continues to rank among the largest telecommunications companies in the world. Its strong cash flow, recurring subscription revenue, and nationwide wireless infrastructure support consistent profitability and shareholder returns.
Verizon Financial Snapshot
| Financial Metric | Latest Available |
|---|---|
| Revenue | $138.2 Billion |
| Net Income | $17.6 Billion |
| Operating Income | $29.3 Billion |
| EBITDA | $47.7 Billion |
| Operating Margin | 21.2% |
| Net Profit Margin | 12.7% |
| Free Cash Flow | Approximately $19–20 Billion |
| Dividend Yield | Approximately 6%+ (varies with share price) |
| Market Capitalization | Approximately $180–200 Billion (market dependent) |
| Diluted EPS | $4.06 |
Quick Fact: Verizon has increased its annual dividend for nearly two decades, making it one of the most consistent dividend-paying companies in the U.S. telecommunications industry.
Financial Strength Highlights
Strong Recurring Revenue
Over 70% of Verizon’s revenue comes from recurring subscription-based wireless and broadband services, providing stable cash flow even during periods of economic uncertainty.
Healthy Operating Cash Flow
Verizon generates tens of billions of dollars in annual operating cash flow, enabling the company to:
- Expand its nationwide 5G network
- Invest in fiber broadband infrastructure
- Reduce long-term debt
- Fund dividend payments
- Modernize enterprise services
Investment in Growth
Capital expenditures remain elevated because Verizon continues investing in:
- 5G Ultra Wideband
- C-Band deployment
- Fiber expansion
- Fixed Wireless Access
- AI-powered network automation
- Edge computing infrastructure
These investments may reduce short-term profitability but are expected to strengthen long-term earnings potential.
Verizon Profit Forecast Through 2030
The U.S. telecommunications industry is entering a new phase driven by 5G Advanced, artificial intelligence, cloud networking, and enterprise digital transformation. Verizon is well-positioned to benefit from these long-term trends.
Analyst Expectations
Industry analysts generally expect Verizon to maintain:
- Stable annual revenue
- Healthy operating margins
- Strong free cash flow
- Consistent dividend growth
- Moderate earnings growth over the long term
Rather than pursuing rapid subscriber growth at any cost, Verizon has focused on improving profitability through premium services, customer retention, and operational efficiency.
Industry Trends Supporting Future Growth
1. Expansion of 5G Advanced
The next evolution of 5G technology will improve:
- Network capacity
- Lower latency
- AI-assisted traffic management
- Industrial automation
- Smart manufacturing
- Autonomous transportation
These capabilities are expected to create new enterprise revenue opportunities.
2. Fixed Wireless Access (FWA)
Fixed Wireless Access has become one of Verizon’s fastest-growing broadband segments.
Future growth drivers include:
- Rural broadband expansion
- Small business connectivity
- Home internet replacement
- Lower infrastructure costs compared with traditional cable deployment
3. Artificial Intelligence
AI is becoming increasingly important across Verizon’s operations.
Potential applications include:
- Predictive network maintenance
- Customer service automation
- Fraud detection
- Intelligent traffic routing
- Energy optimization
- Personalized customer experiences
These initiatives could improve operating efficiency and support stronger profit margins.
4. Private 5G Networks
Many enterprises are deploying dedicated private 5G networks to support:
- Manufacturing
- Logistics
- Healthcare
- Retail
- Warehousing
- Energy production
Enterprise networking is expected to become a significant long-term revenue driver.
5. Internet of Things (IoT)
The rapid growth of connected devices—including vehicles, industrial equipment, smart cities, and healthcare systems—will increase demand for reliable wireless connectivity and managed network services.
Potential Risks
While Verizon’s outlook remains positive, several factors could affect future profitability:
- Rising interest rates
- Increased competition
- Regulatory changes
- Higher spectrum acquisition costs
- Slower-than-expected subscriber growth
- Macroeconomic uncertainty
The company’s continued focus on cost discipline and infrastructure efficiency will be critical to maintaining healthy margins.
Key Takeaways
- Verizon remains one of the largest and most profitable telecom providers in the United States.
- Recurring wireless revenue provides a stable earnings base.
- Continued investment in 5G, fiber, and AI is expected to support long-term profitability.
- Strong free cash flow enables Verizon to invest in growth while maintaining an attractive dividend.
- Although competition remains intense, Verizon’s financial position and operational scale provide a solid foundation for future expansion.
People Also Ask
What is Verizon’s net income in 2026?
As of 2026, the latest available full-year financial data (FY2025) shows Verizon reported approximately $17.6 billion in net income. Updated 2026 results will be available after the company releases its annual financial statements.
What is Verizon’s current profit margin?
Based on the latest available annual results, Verizon’s net profit margin is approximately 12.7%, while its operating margin is approximately 21.2%.
Is Verizon profitable?
Yes. Verizon consistently generates billions of dollars in annual profit and maintains strong operating cash flow, making it one of the most financially stable telecommunications companies in North America.
How does Verizon compare with AT&T?
Both Verizon and AT&T are major U.S. telecom providers. Verizon generally maintains strong operating margins and recurring wireless revenue, while AT&T has focused heavily on debt reduction and fiber expansion following its recent restructuring.
Has Verizon’s profit increased over time?
Verizon’s profitability has fluctuated because of major investments, interest expenses, and accounting adjustments. Despite these variations, the company has remained consistently profitable and has generated strong cash flow over the long term.
What affects Verizon’s profitability?
Key factors include:
- Wireless subscriber growth
- Service revenue
- 5G infrastructure investment
- Operating expenses
- Interest costs
- Broadband expansion
- Customer retention
- Competitive pricing
- Regulatory policies
Why is Verizon investing so heavily in 5G?
5G is expected to drive long-term revenue growth through faster mobile services, enterprise networking, fixed wireless broadband, IoT, and next-generation digital applications. While these investments increase short-term capital expenditures, they are intended to strengthen Verizon’s long-term competitive position.
Does Verizon generate strong cash flow?
Yes. Verizon consistently produces strong operating and free cash flow, enabling the company to fund network investments, reduce debt, and return capital to shareholders through dividends.
Conclusion
Verizon remains one of the strongest financial performers in the global telecommunications industry. Despite the capital-intensive nature of building and maintaining a nationwide communications network, the company continues to deliver stable revenue, healthy operating margins, and billions of dollars in annual profit.
The latest available financial results show Verizon generated $138.2 billion in revenue, $29.3 billion in operating income, and $17.6 billion in net income, reflecting a net profit margin of approximately 12.7%. These results demonstrate the resilience of Verizon’s subscription-based business model and its ability to generate substantial earnings even while investing heavily in 5G infrastructure, fiber broadband, and enterprise solutions.
Looking ahead, Verizon’s continued focus on AI-powered network optimization, Fixed Wireless Access, private 5G, edge computing, and operational efficiency is expected to support sustainable profitability through 2030. Although competitive pressures and macroeconomic conditions remain important considerations, Verizon’s diversified revenue streams, strong cash generation, and disciplined capital allocation position the company well for long-term growth.
- Verizon Statistics 2026: Revenue, Subscribers & Market Share
- Verizon 5G Business Internet – Up to $1,500 Off When You Switch
- Verizon Fios Mobile + Home Internet – Save $15/Month
- New Customers: Verizon Fios Home Internet Plans – Up to 45% Off